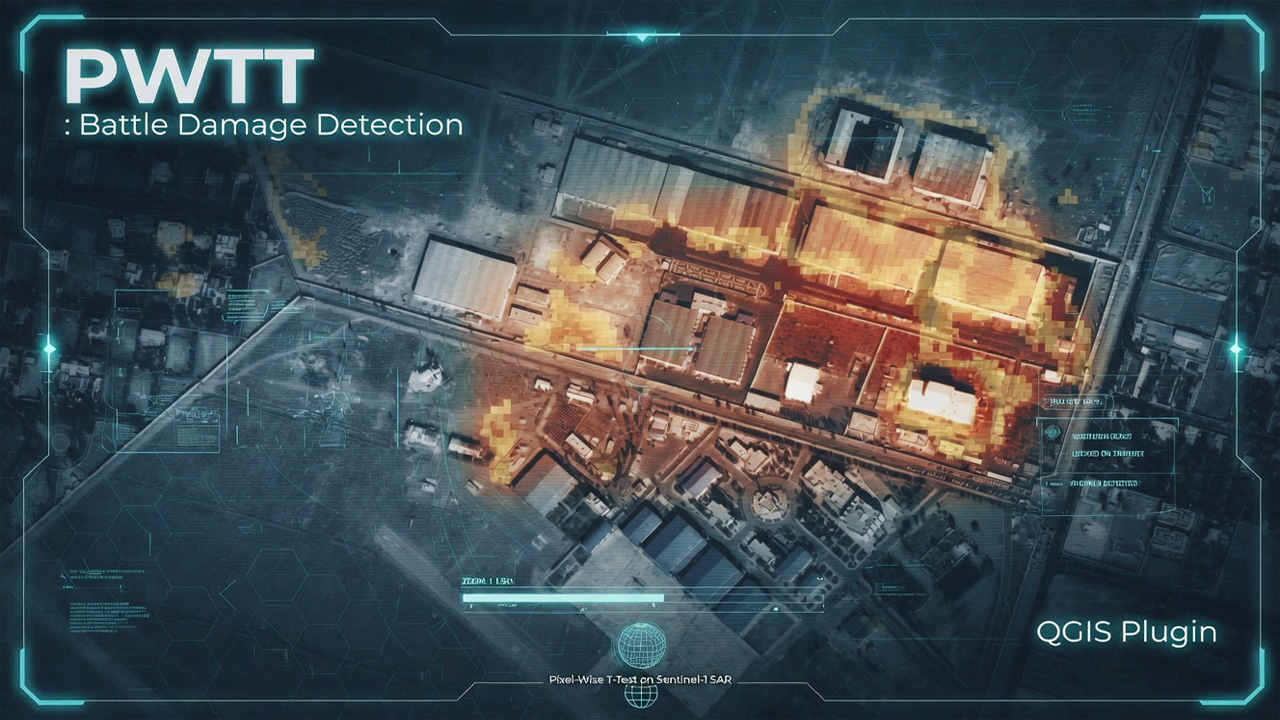
Track the Unseen - Spot Change Anywhere, Any Time
The QGIS plugin featured in this guide was developed by Salaheldinaz. It was tested extensively over the past few days by Mostafa. We put together this walkthrough to help others get started.
What Is This About?
Imagine you could look at any place on Earth and ask: “Has something changed here in the last few months?” — a building destroyed, a new structure built, a road carved through a forest. That is exactly what the PWTT QGIS Plugin lets you do, for free, from your own computer.
PWTT stands for Pixel-Wise T-Test. It was originally developed by researcher Ollie Ballinger and used by Bellingcat to map war damage in places like Ukraine, Gaza, and Iran — places where governments often block access to optical satellite imagery. The method was published as a peer-reviewed paper in Remote Sensing of Environment and validated across over 2 million labeled buildings in 30 cities.
The plugin featured in this guide takes that same technology and makes it more practical for everyday use: you can save your areas of interest, create monitoring projects, run batch analysis, and view time-series data — all inside QGIS on your own machine.
Why radar and not regular photos?
How PWTT Works?
(The Simple Version)
The European Space Agency operates a satellite called Sentinel-1. Instead of taking photos like a camera, it sends pulses of microwave energy toward the ground and measures what bounces back — like sonar, but from space.
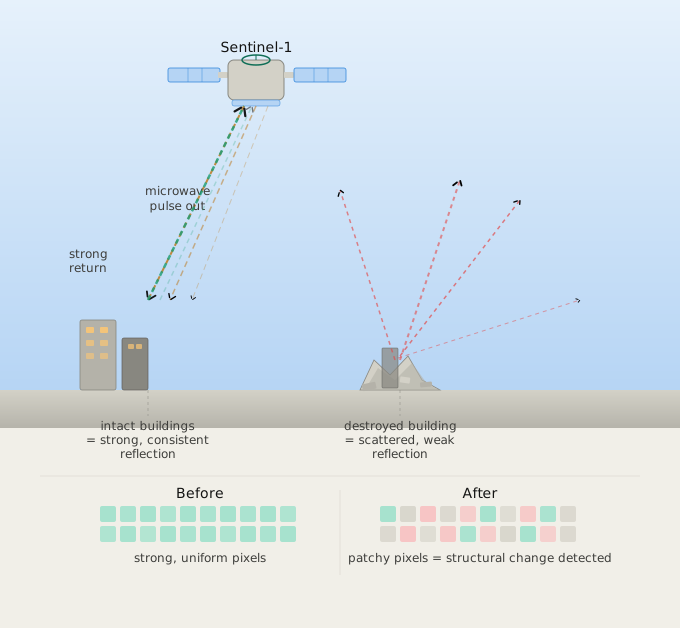
Buildings, roads, and structures bounce the signal back in a specific way. When a building is destroyed, or a new one is built, the bounce pattern changes.
The PWTT method works in three simple steps:
Not just for war damage
What This Looks Like in Practice
To give you a sense of what the plugin can actually reveal, here are two real examples. In both cases, the PWTT plugin flagged areas of change from radar data alone — then optical satellite imagery from Planet Labs was used to confirm what happened on the ground.
Example 1: Detecting change in a desert compound
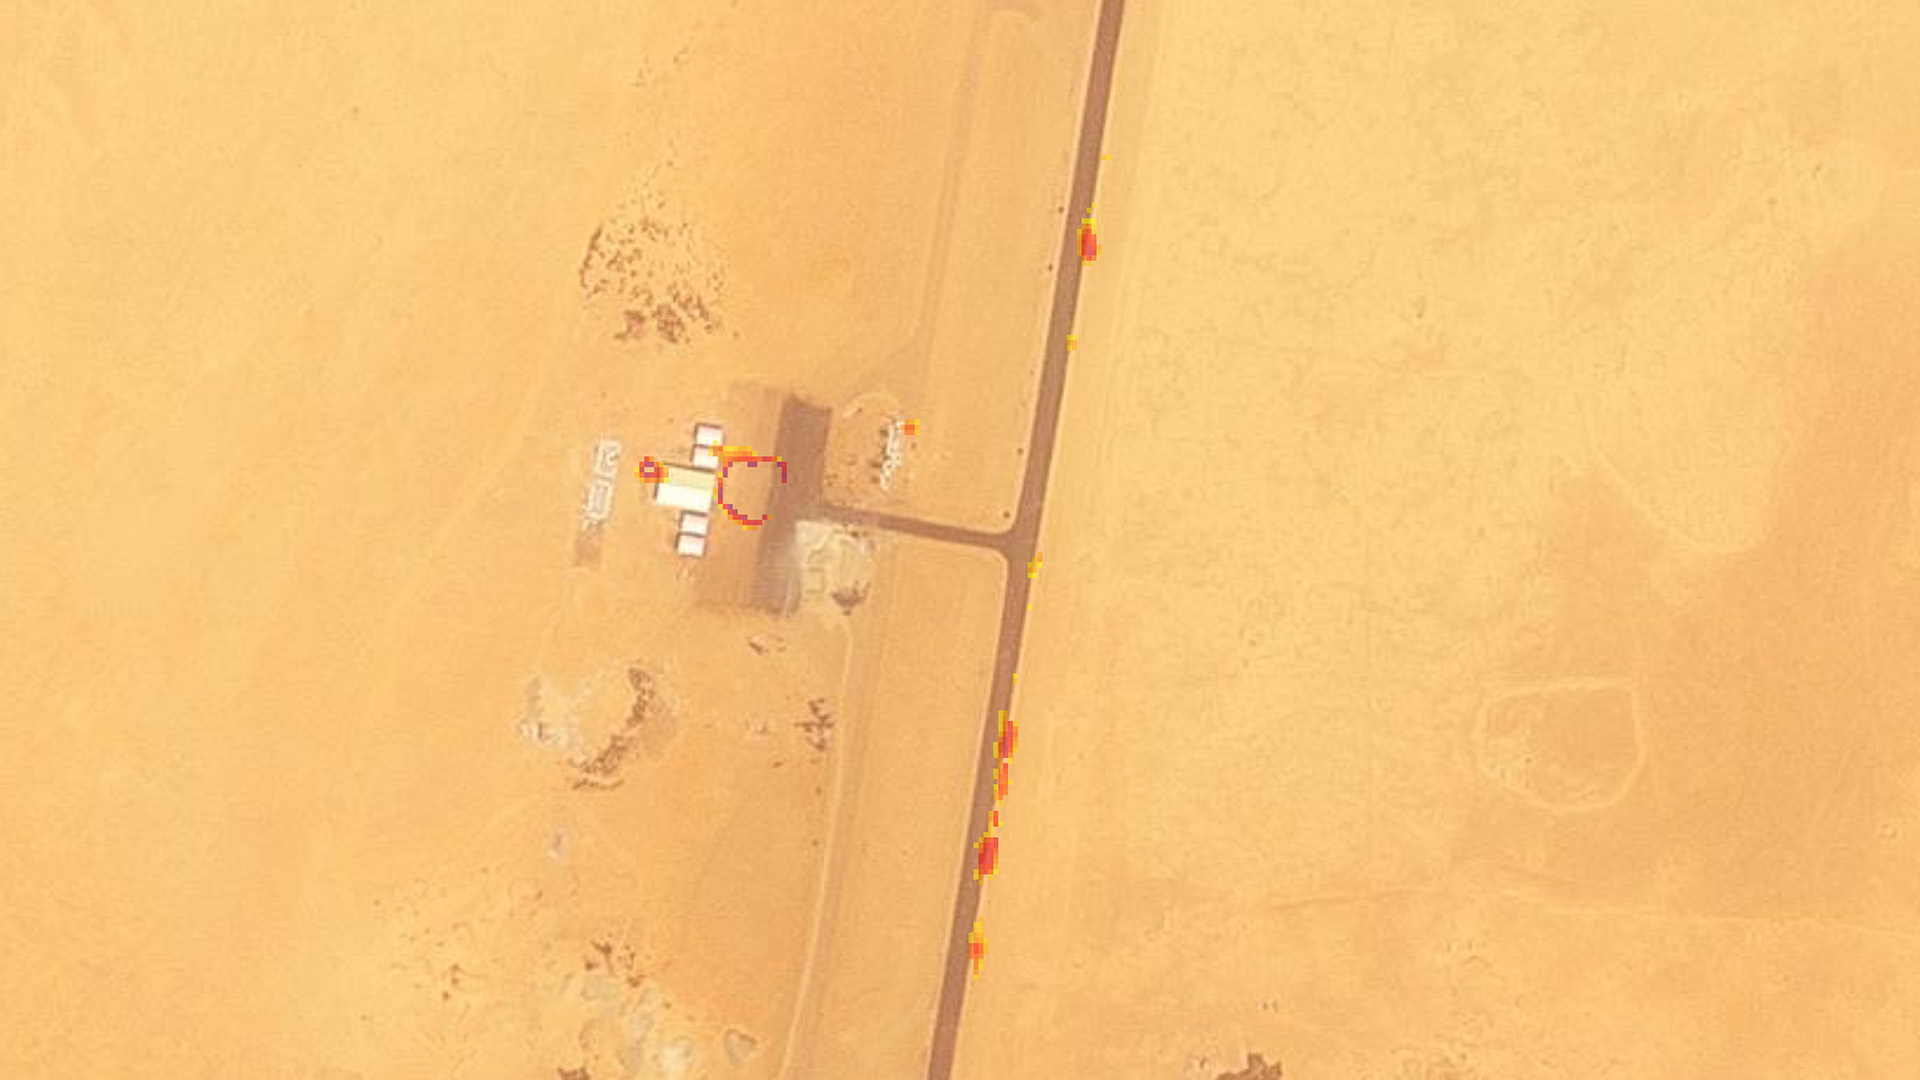
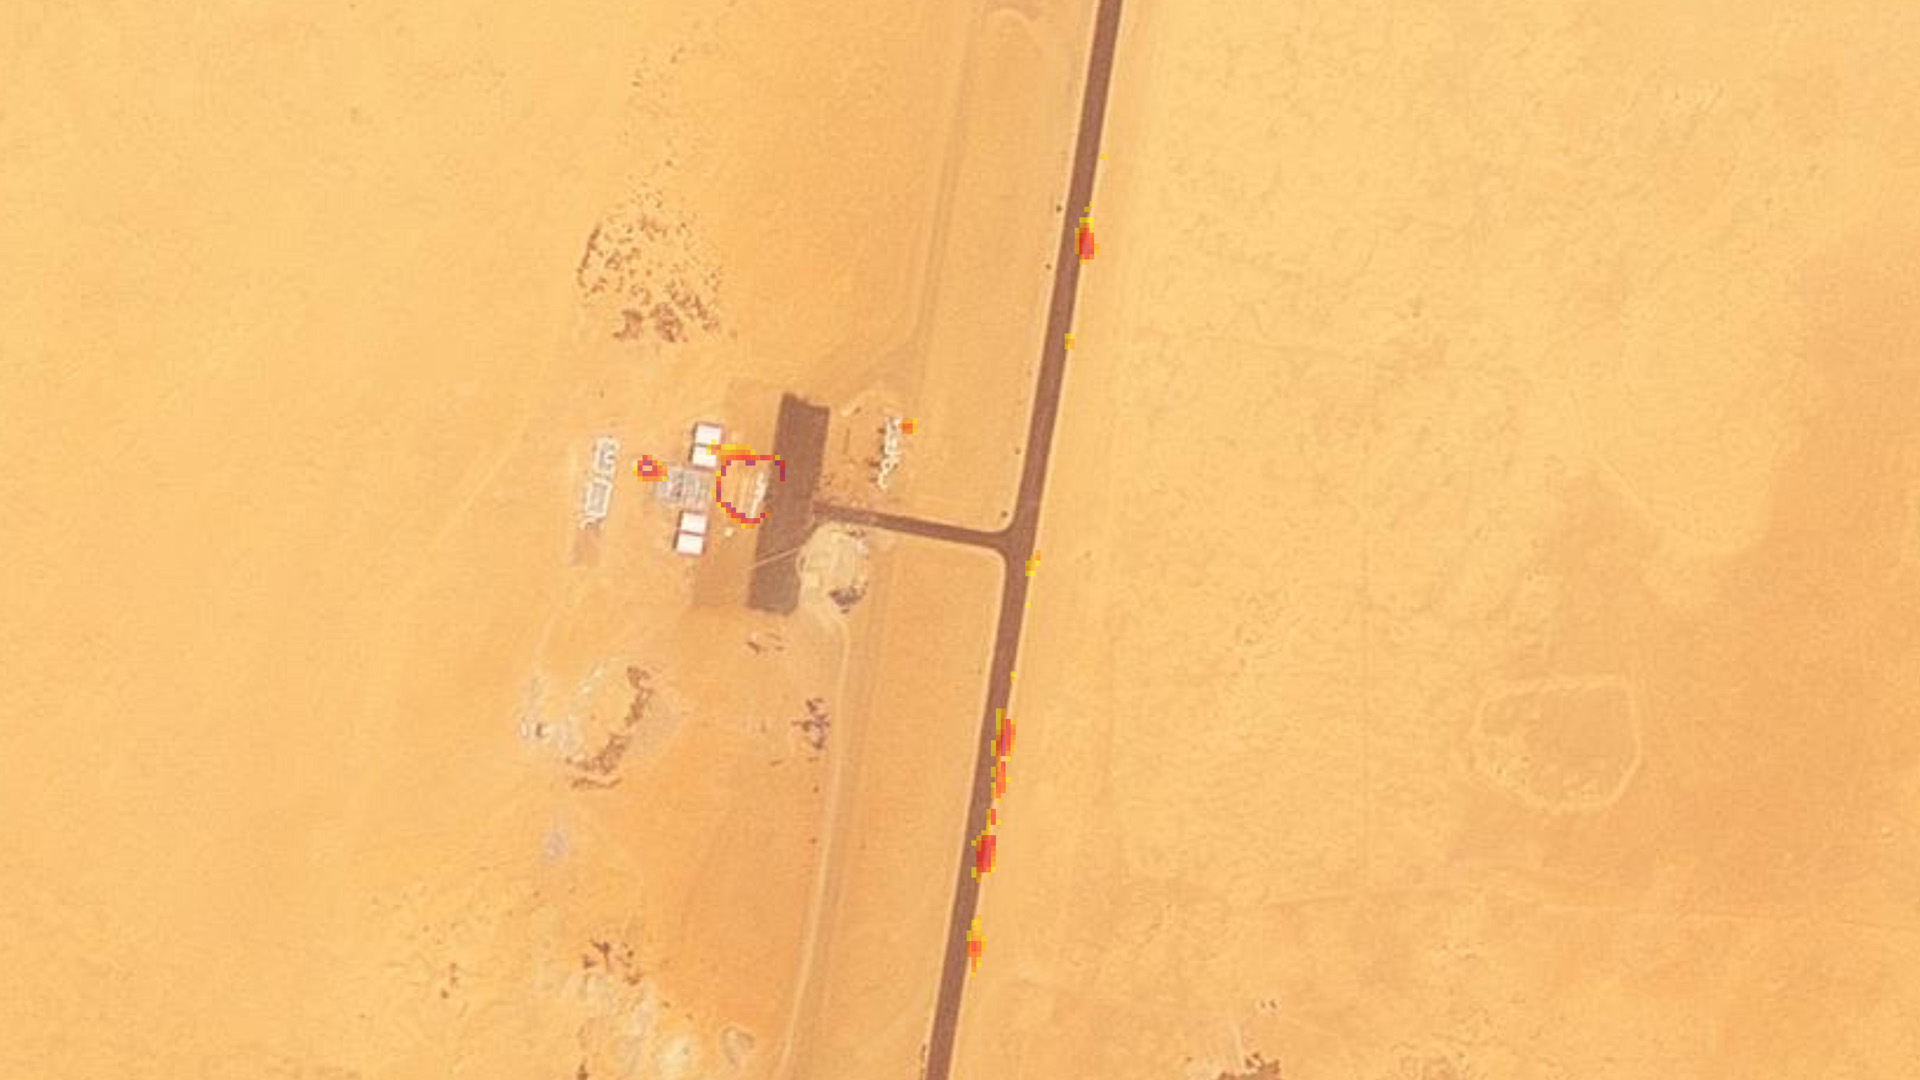
Matan As Sarra, Libya | 21.688°N, 21.828°E.
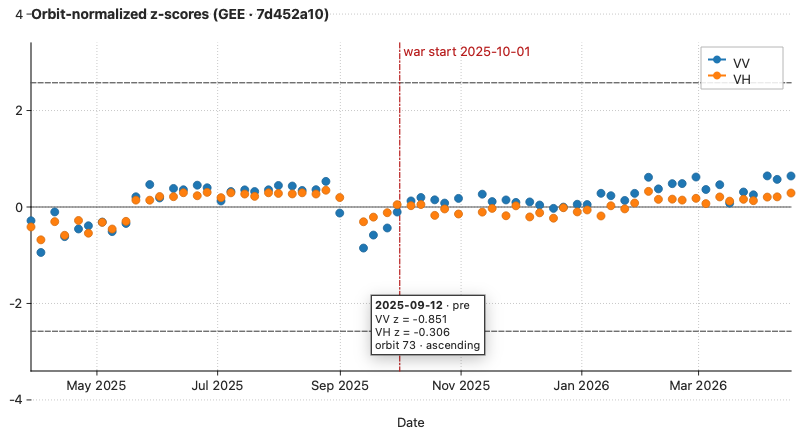
The PWTT time series chart for this location shows slight deviations in the VV radar signal on approximately 2 April 2025 and 12 September 2025 - both data points dip noticeably below the cluster of neighboring readings. Optical satellite imagery from Planet Labs confirms a visible change on the ground around that date. Imagery source: Planet Labs.
In this example, the plugin’s time series chart showed a subtle dip in the VV radar signal around September 2025. The deviation was small — not enough to cross the tool’s statistical significance threshold on its own — but it stood out from the otherwise stable baseline. A closer look using optical imagery confirmed a visible change at the site between August and October 2025.
Key takeaway
Example 2: Tracking new construction near an airstrip
Asosa airport, Ethiopia.
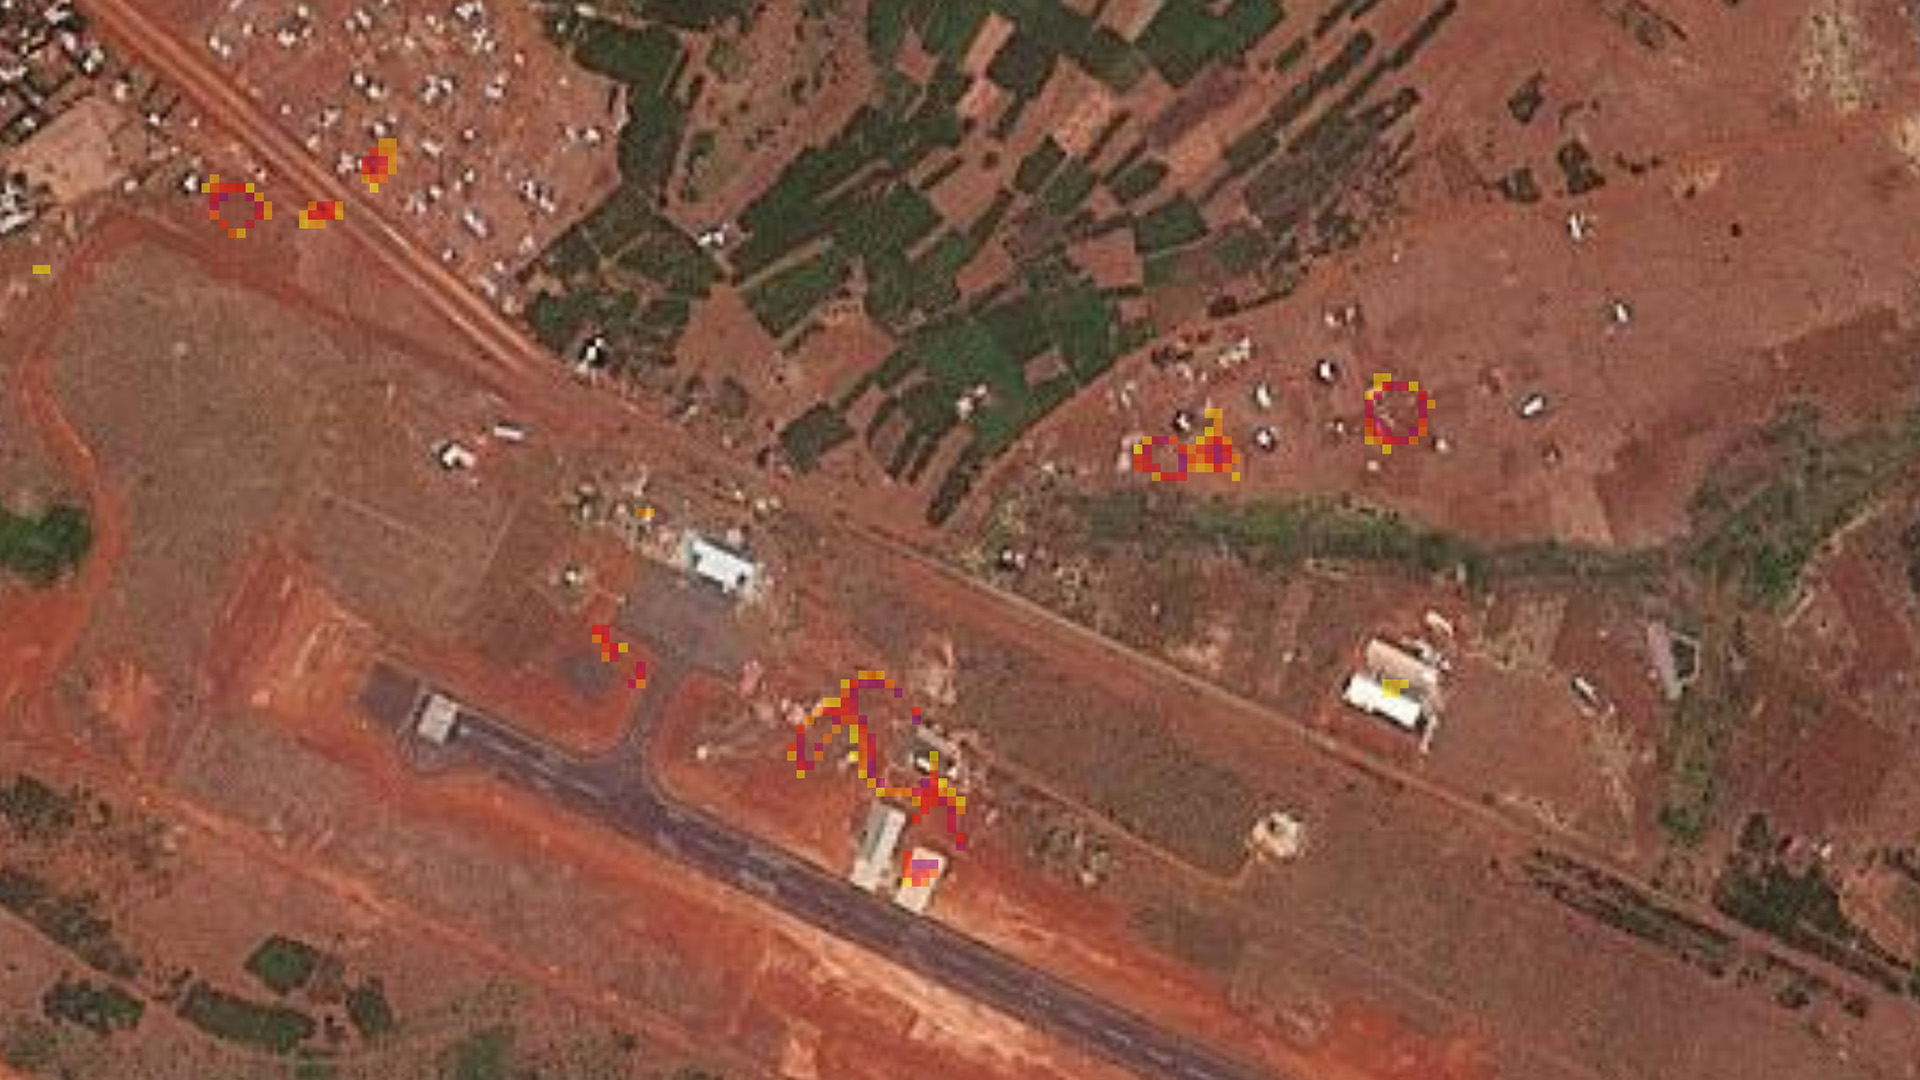
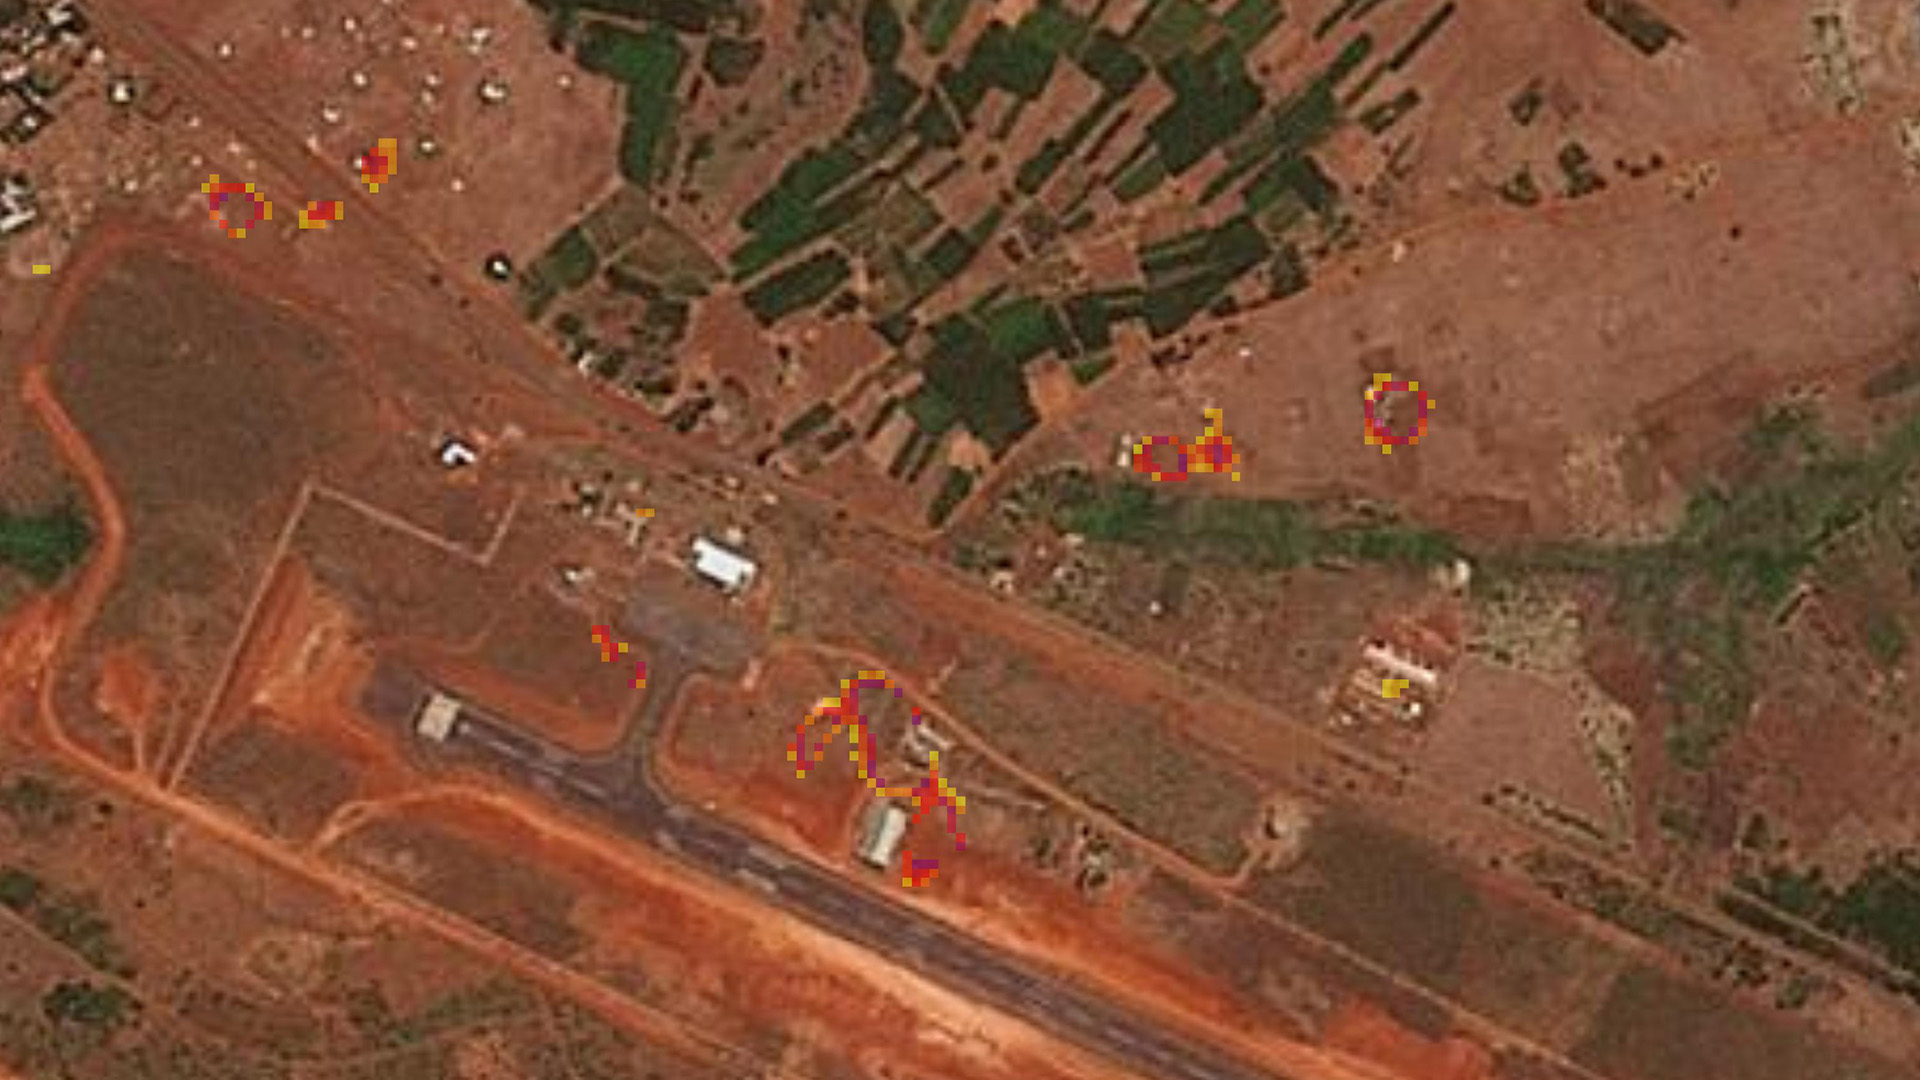
New construction detected. The PWTT plugin flagged several change clusters (red/yellow pixels) near an airstrip. The optical imagery confirms new structures appeared between May 2025 and April 2026. The plugin detected these changes using radar data alone; the optical imagery serves as ground-truth confirmation. Imagery source: Planet Labs.
In this second example, the plugin flagged several clusters of change (shown in red and yellow) near an airstrip in a rural area. Comparing optical imagery from May 2025 (before) and April 2026 (after) shows that the detected changes correspond to new structures and ground disturbance — evidence of construction activity that would have been difficult to spot without monitoring.
These examples illustrate the two sides of the plugin’s value: it can detect both destruction (things disappearing) and construction (things appearing). For journalists and researchers, this means you can use a single tool to monitor any kind of physical change in an area of interest — from conflict damage to clandestine building activity.
What You Need Before Starting
Before installing the plugin, you will need three things. All of them are free.
QGIS 3.22+
Copernicus account
Google Earth Engine
🤔 Which backend should I pick?
Detailed Walkthrough
Setting Up Google Earth Engine
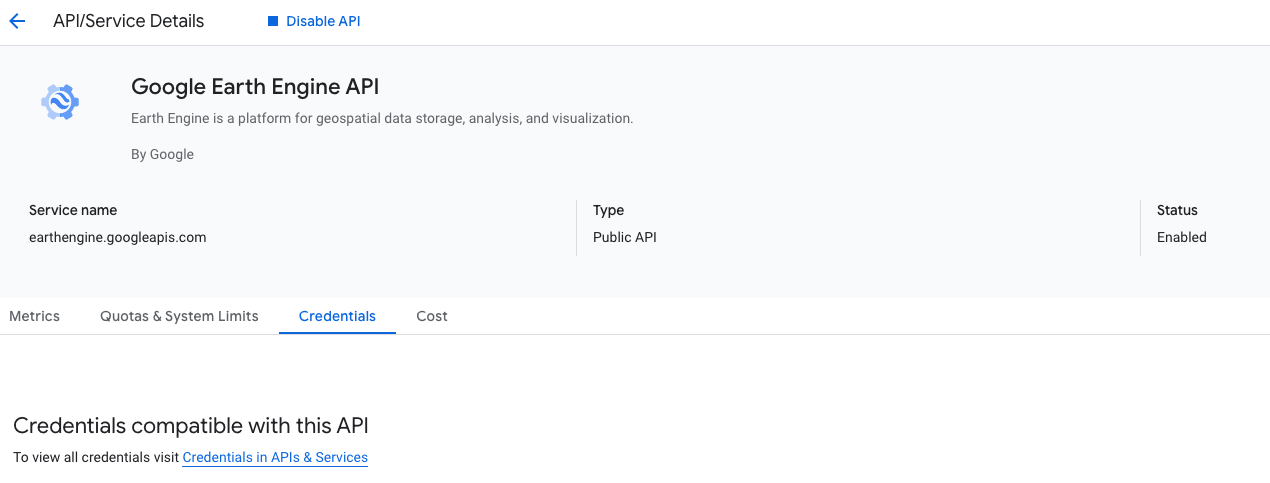
Google Earth Engine requires a bit more setup than just creating an account. You need to create a Google Cloud project, enable the Earth Engine API, set up OAuth credentials, and register the project with Earth Engine. It sounds complicated, but it is mostly clicking through forms. Follow these steps exactly.
Part A: Enable the Earth Engine API
Registering Your Project with Earth Engine
Navigate to Earth Engine → Configuration in your Google Cloud Console. You will see two options: Register for commercial use and See if you are eligible for noncommercial use. For journalism and research, click “Get started” under noncommercial use.
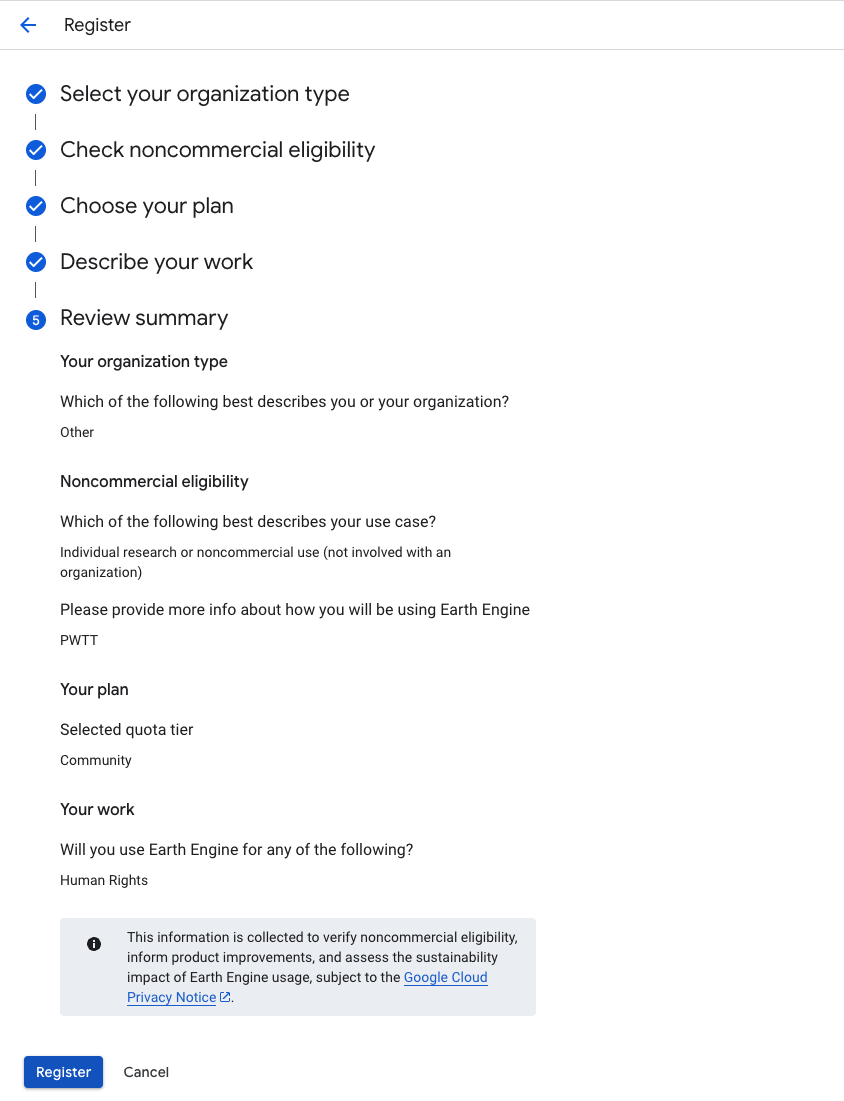
The registration walks you through five steps:
- Organization type: Select what best describes you (e.g., “Other” for individual journalists).
- Noncommercial eligibility: Choose “Individual research or noncommercial use.” In the description field, briefly describe your use (e.g., “OSINT research” or “PWTT damage assessment”).
- Plan: Select “Community” — this is the free tier with 150 EECU-hour limit, which is sufficient for most investigative work. No billing account is required.
- Describe your work: Check the category that fits (e.g., “Human Rights”).
- Review and Register: Review your selections and click Register.
You are now set up
Part B: Configure OAuth Consent Screen
Before you can create credentials, Google requires you to set up an “OAuth consent screen.” This is a one-time setup for your project.
Part C: Create OAuth Client Credentials
Important
Setting Up Copernicus account
Setting up a Copernicus account is quick and straightforward. Simply visit the Copernicus registration page to create your account. Once registered and logged in, you can easily generate your OAuth credentials by going to the account settings section.
Installing the Plugin in QGIS
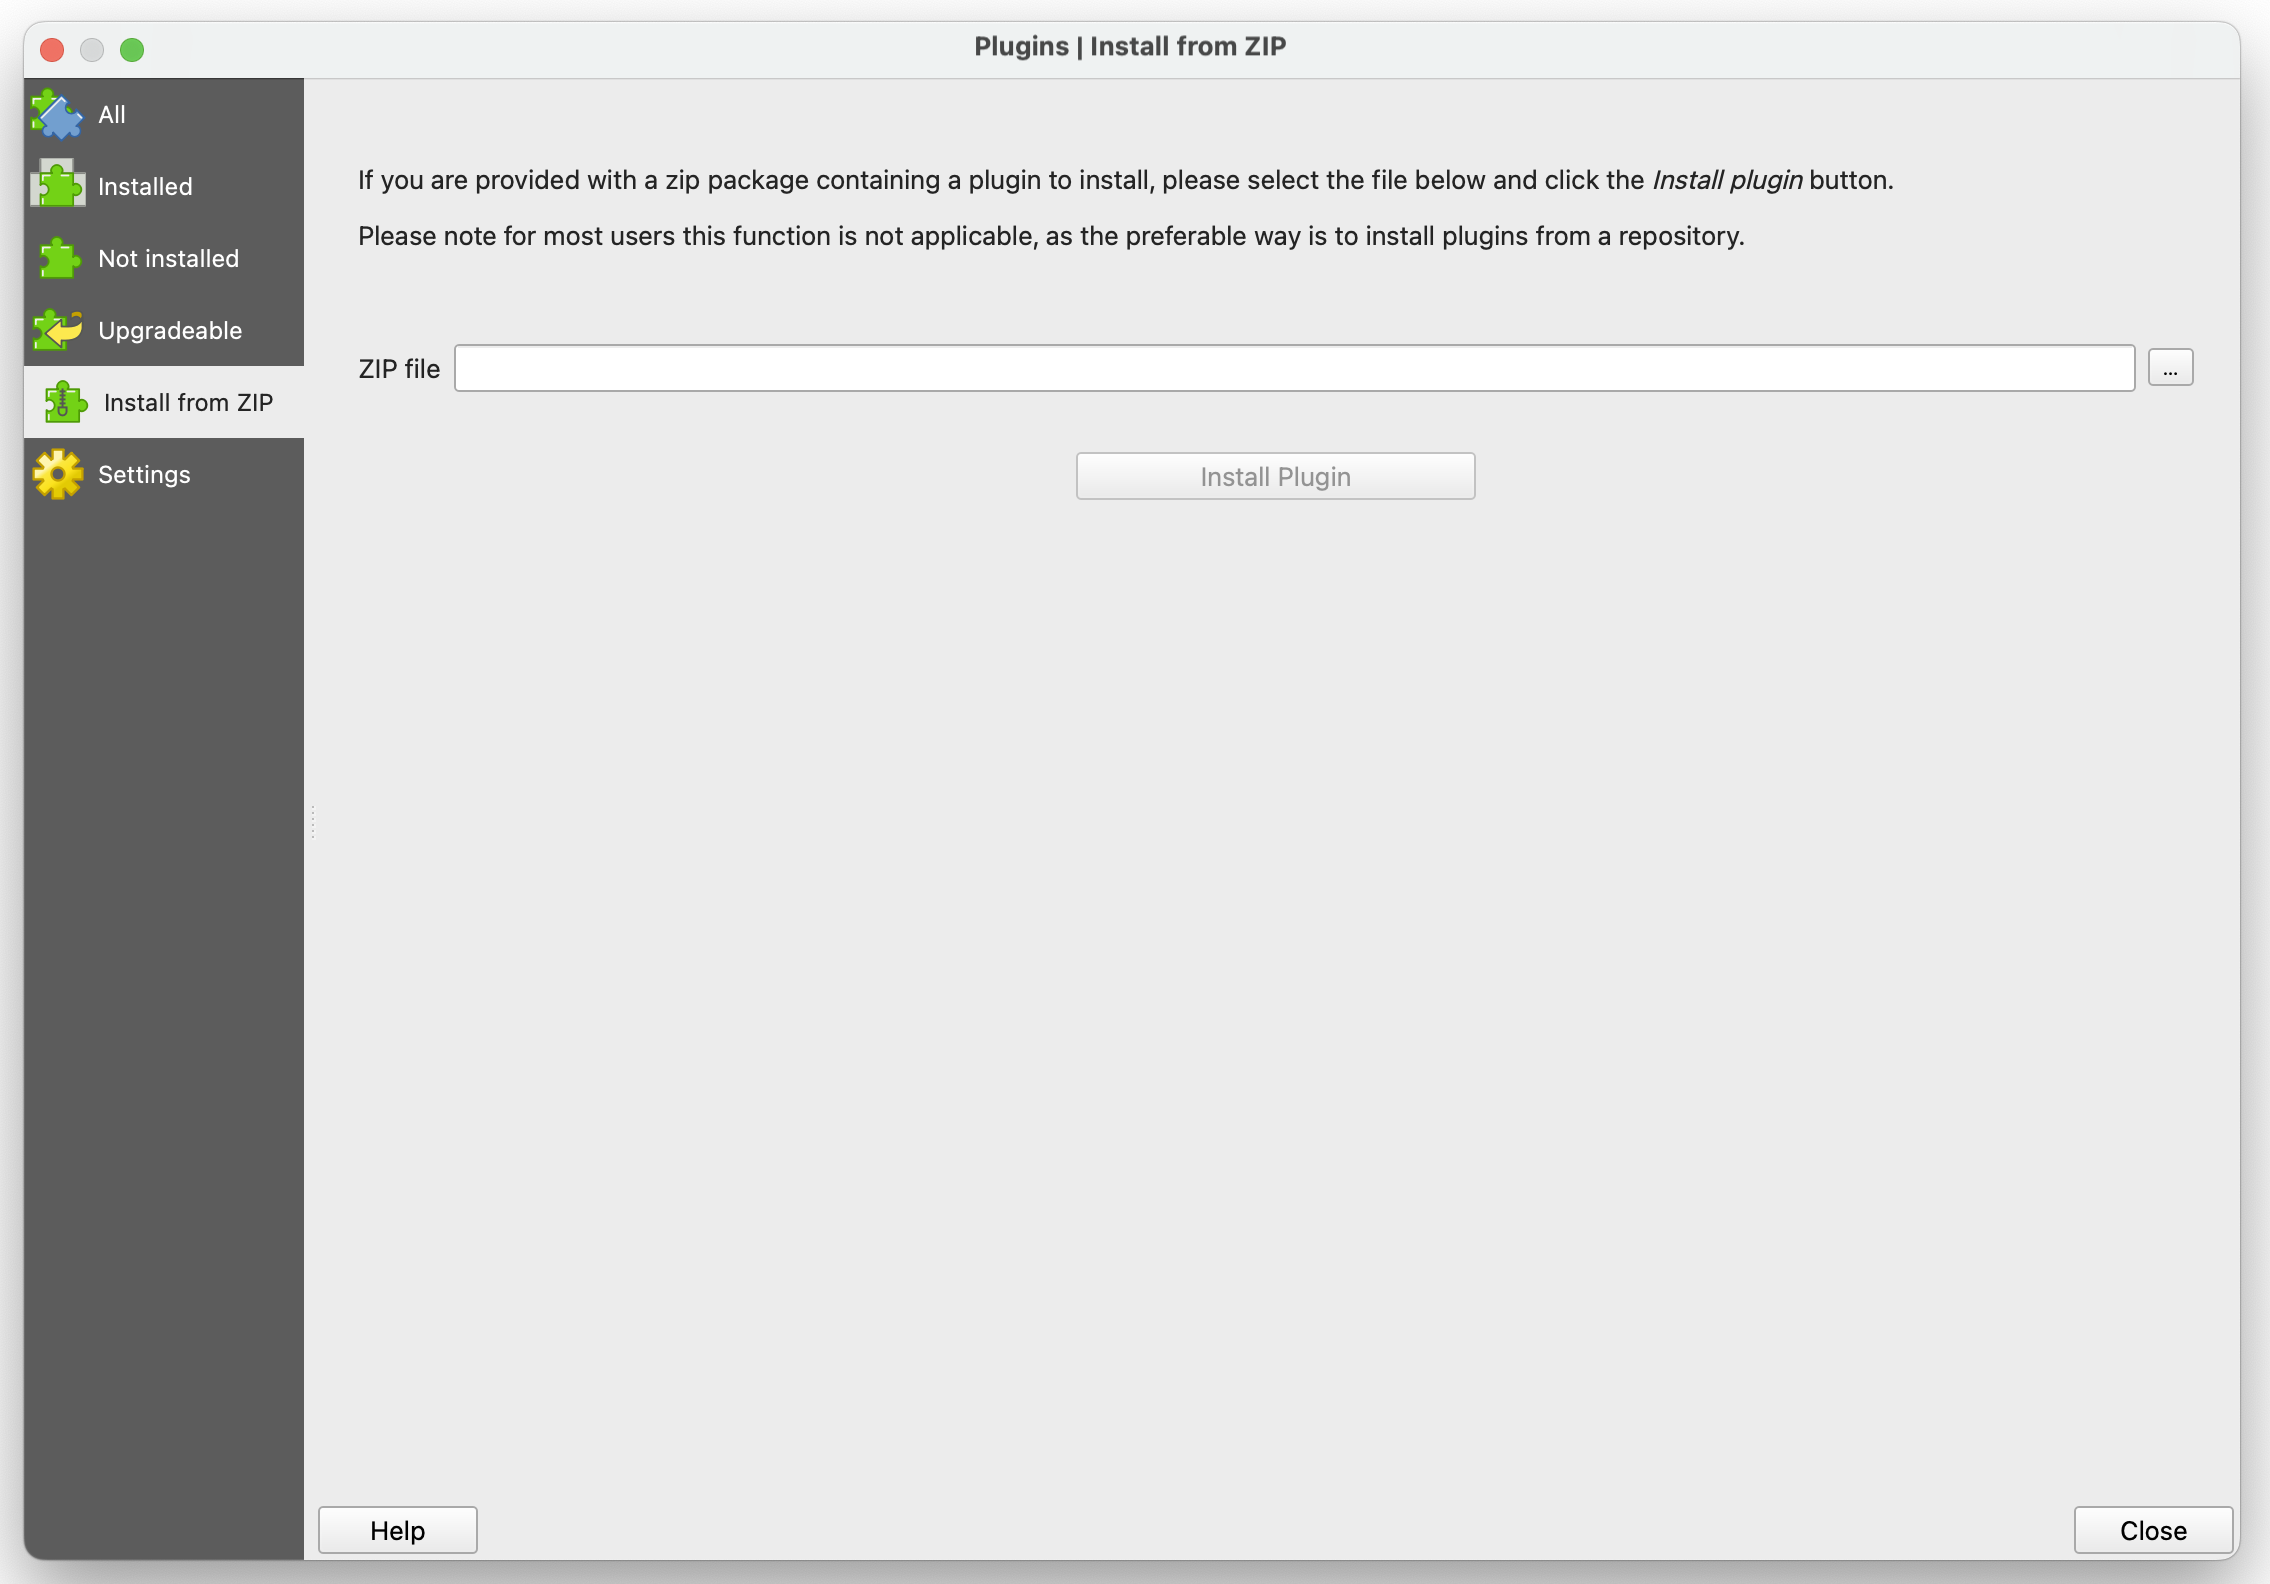
Installing the PWTT plugin in QGIS can be done in two ways. If the plugin is not available in the repository or you need a specific version, you can also install it manually by downloading the plugin as a .zip file and installing it via the “Install from ZIP” option in the QGIS Plugin Manager.
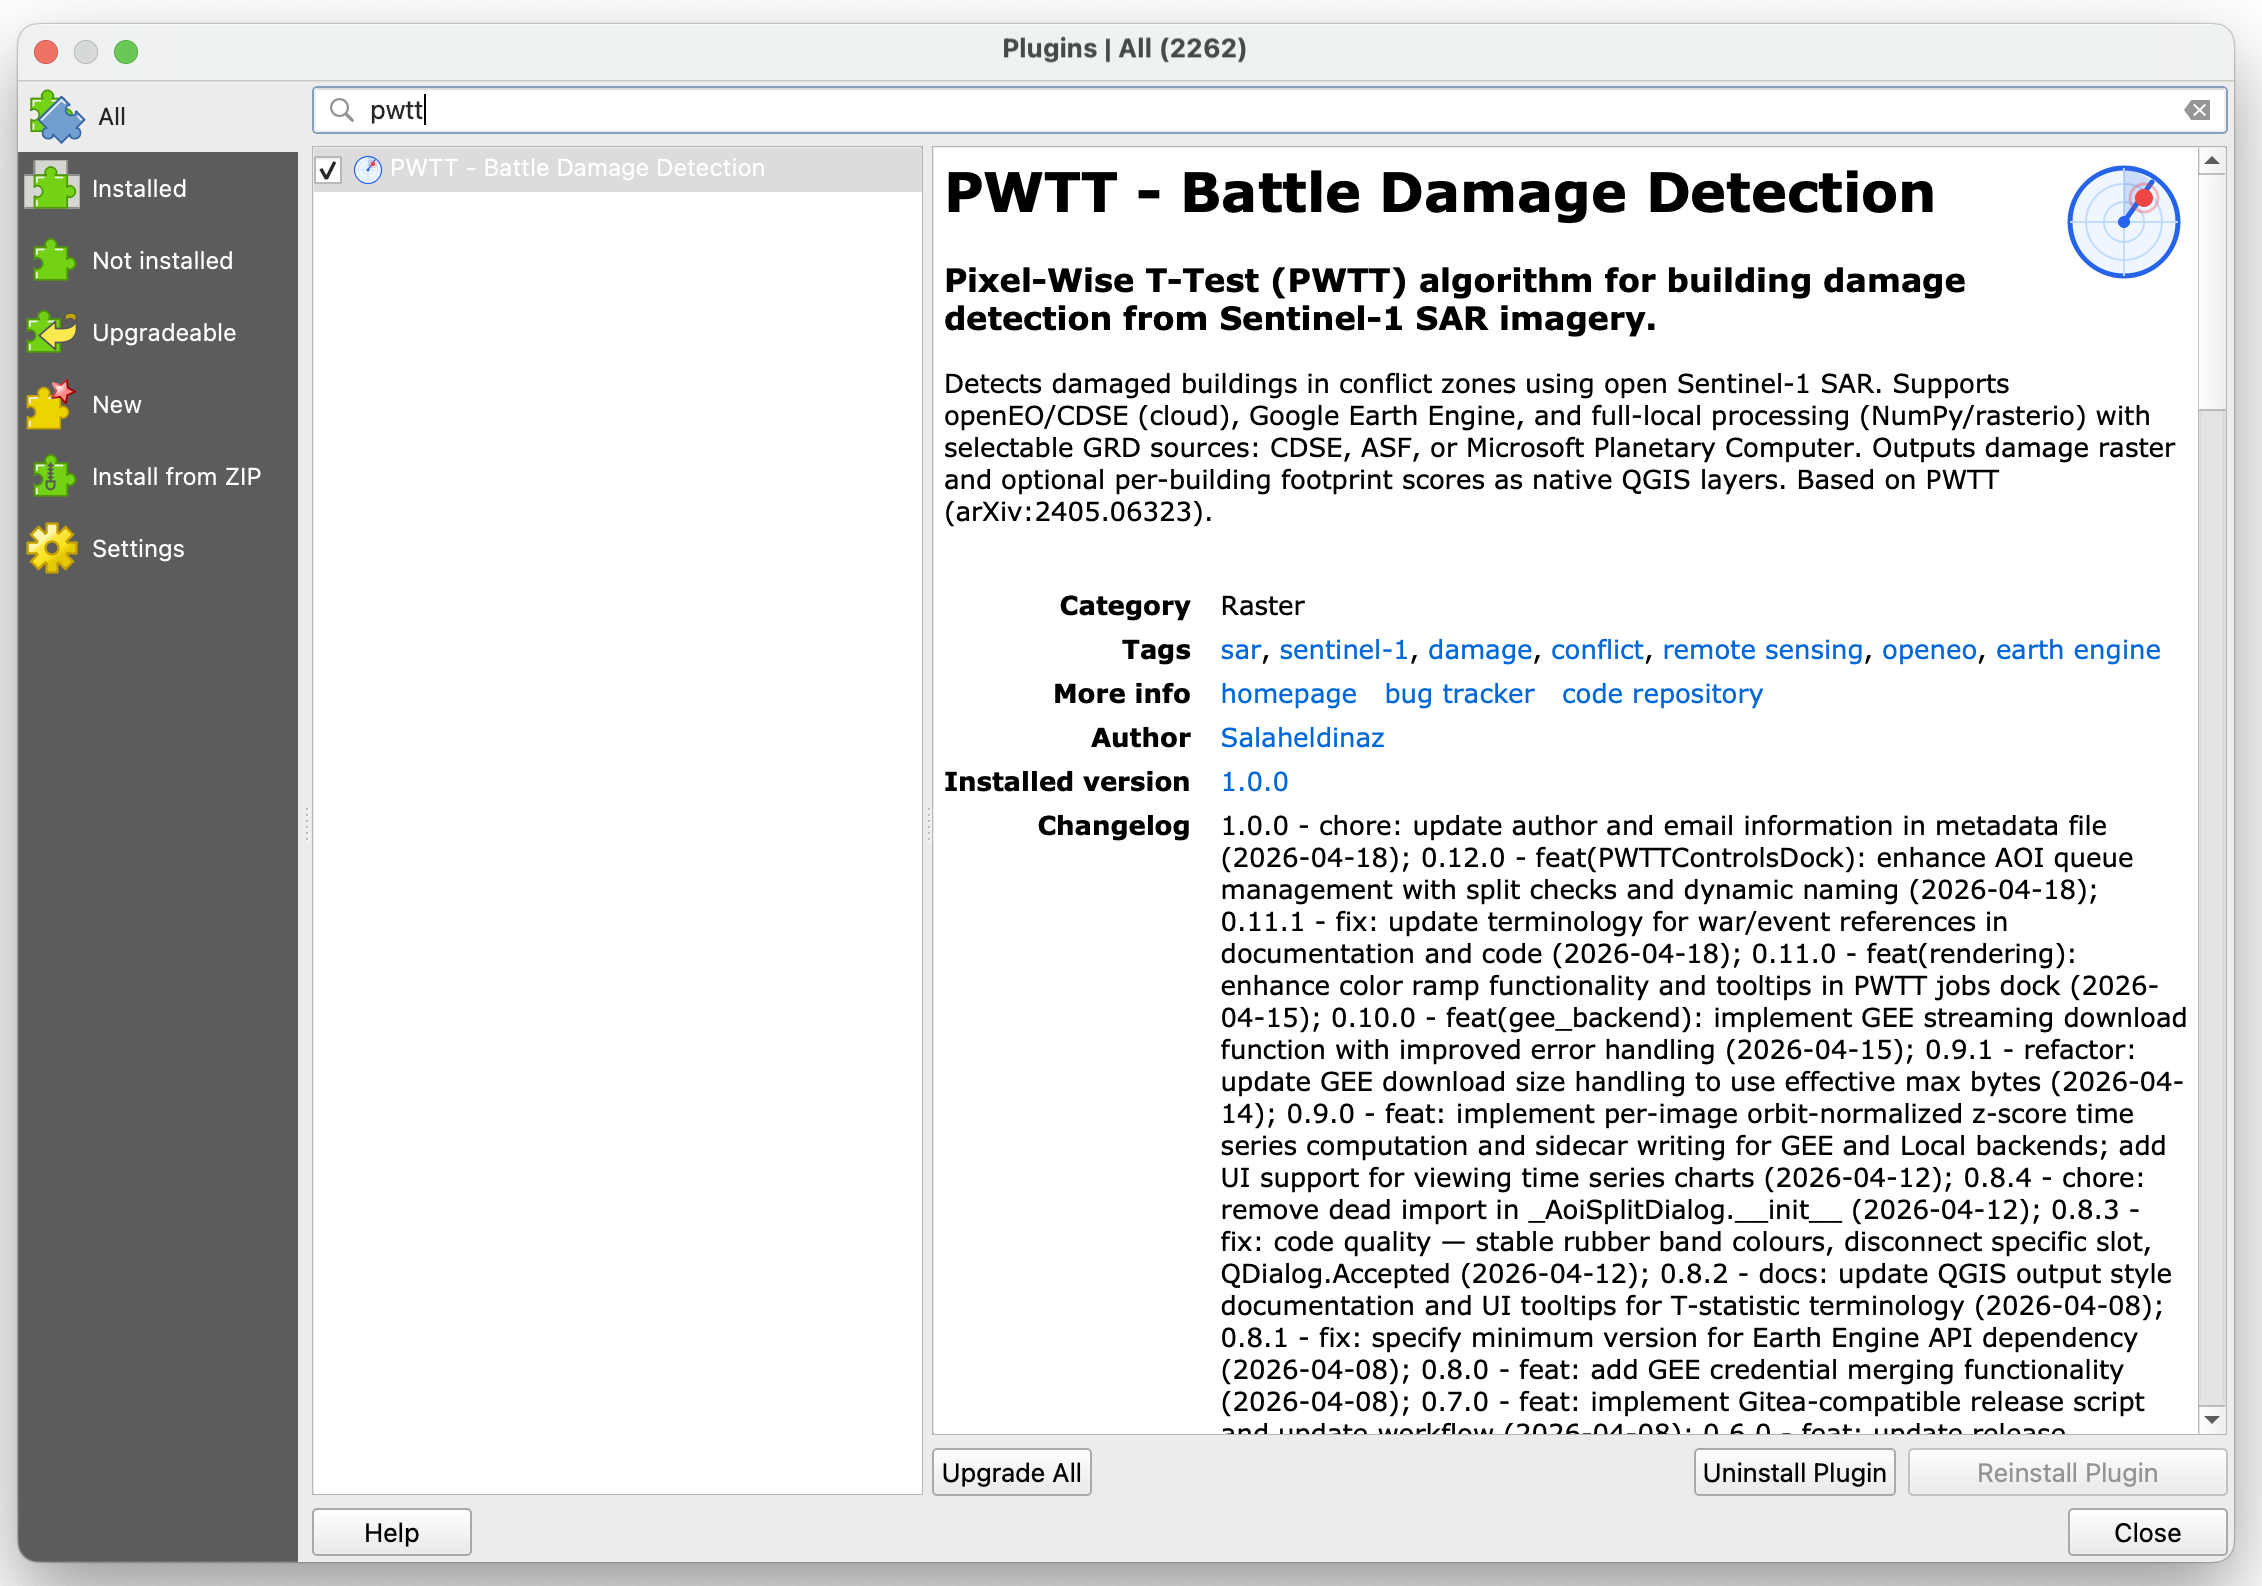
If the plugin is not available in the repository or you need a specific version, you can also install it manually by downloading the plugin as a .zip file from here and installing it via the “Install from ZIP” option in the QGIS Plugin Manager.
_
After installing the Plugin
Open the PWTT panel by clicking the new PWTT icon in your toolbar (or go to Plugins → PWTT). If the plugin tells you that some Python packages are missing, click the “Install Dependencies” button. This downloads small helper libraries the plugin needs to talk to the satellite data servers.
In the PWTT panel, select your preferred backend (e.g., Google Earth Engine). Click Authenticate. A browser window will open asking you to log in with your Google account and authorize access. Follow the prompts.
For Copernicus/openEO: enter your Copernicus credentials directly or use the browser-based OIDC login.
Running Your First Analysis
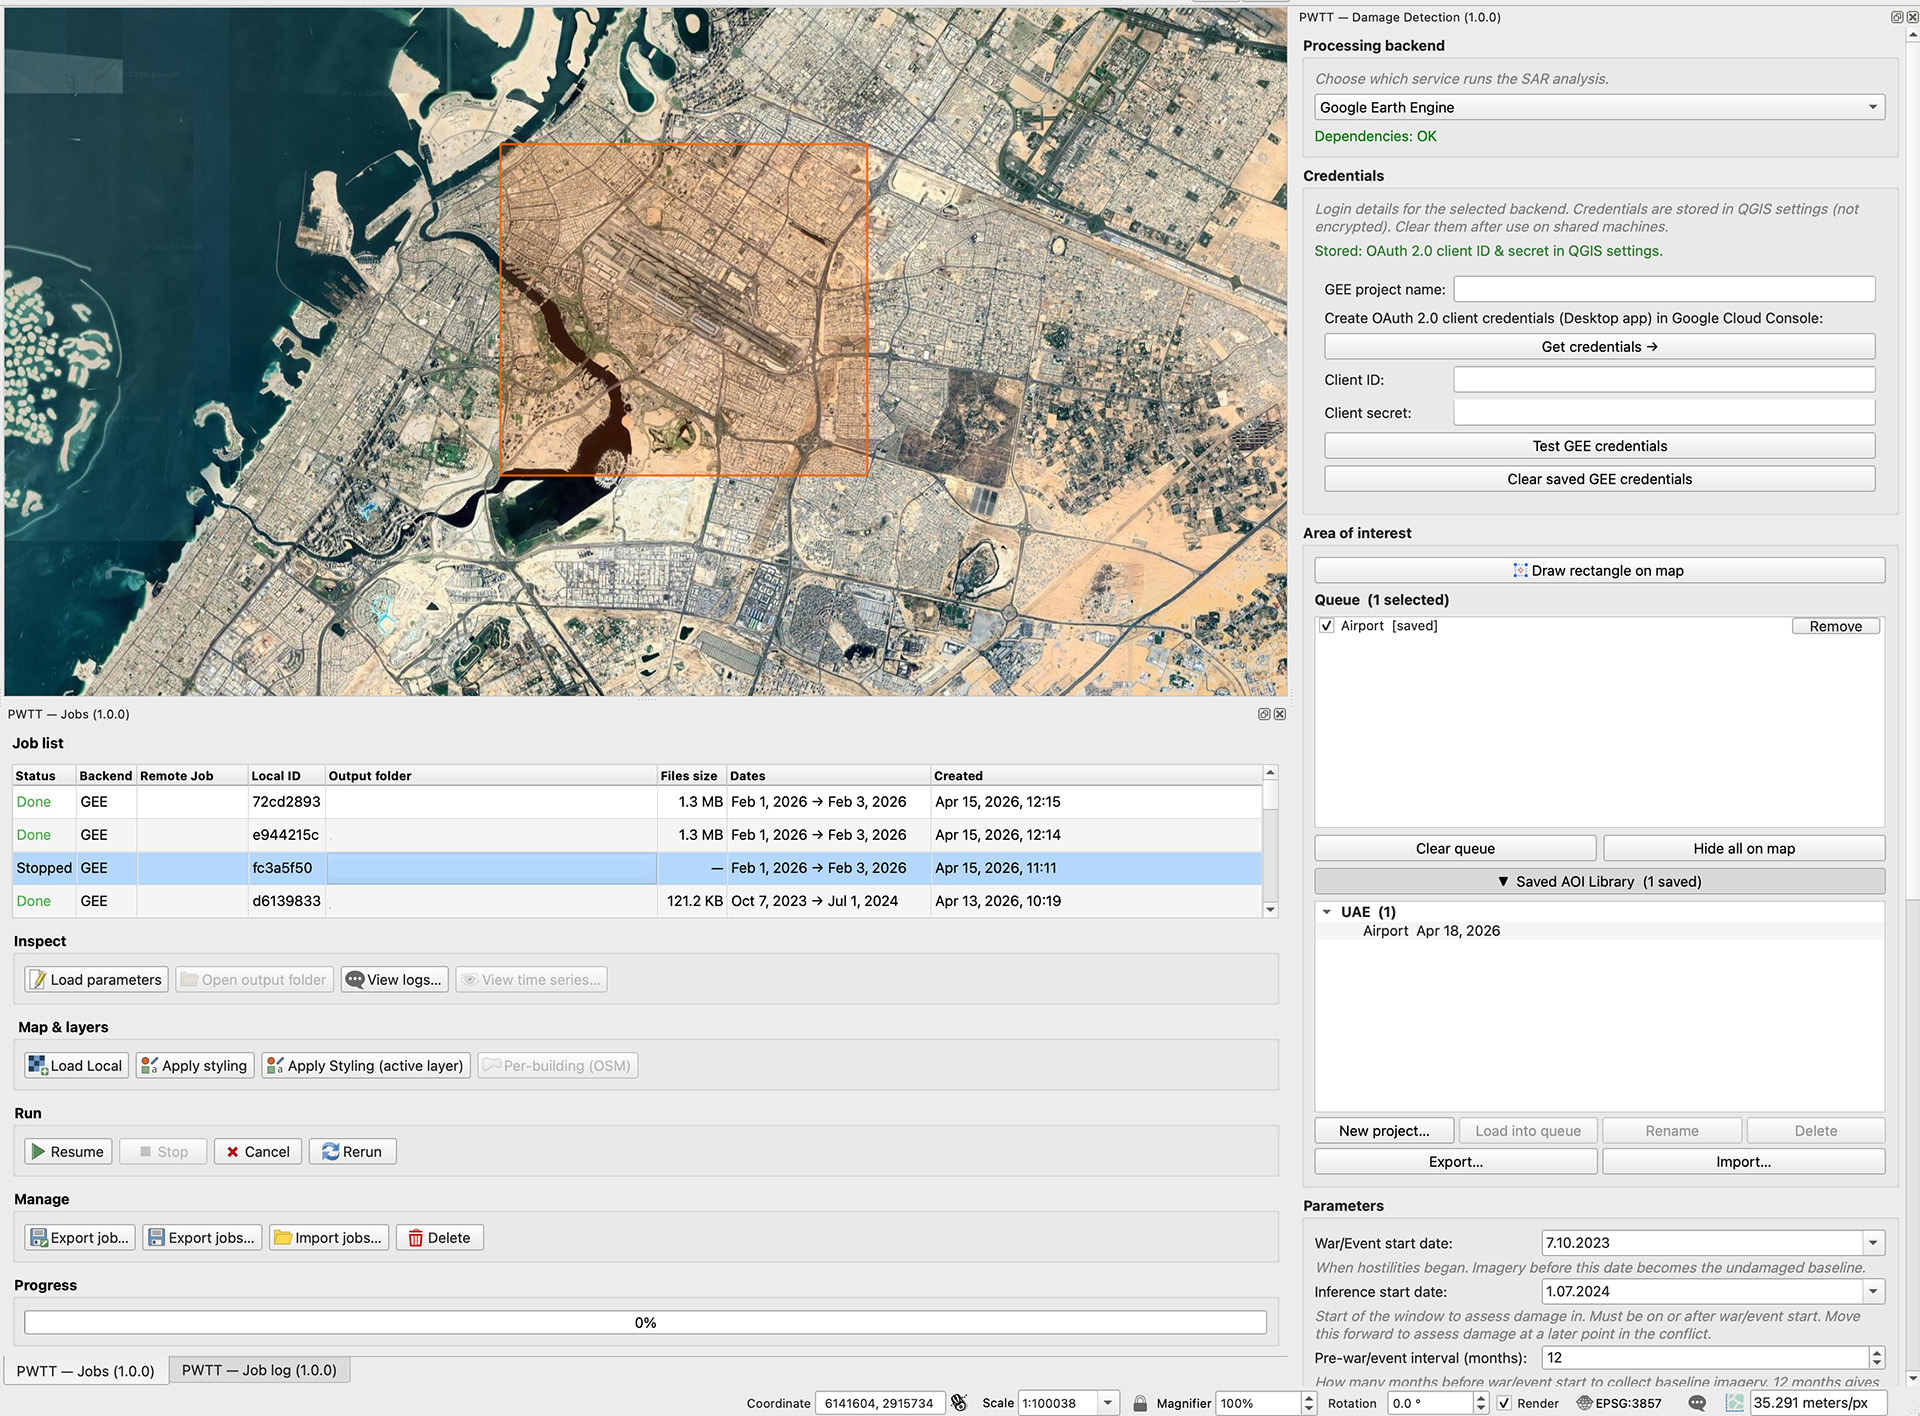
Set two dates:
War/Event start date — This is the date of the event you are investigating. Everything before this date becomes your “normal” baseline. (Despite the name, this works for any event — not just wars.)
Inference start date — This is when the “after” comparison begins. It must be the same as or later than the war start date.
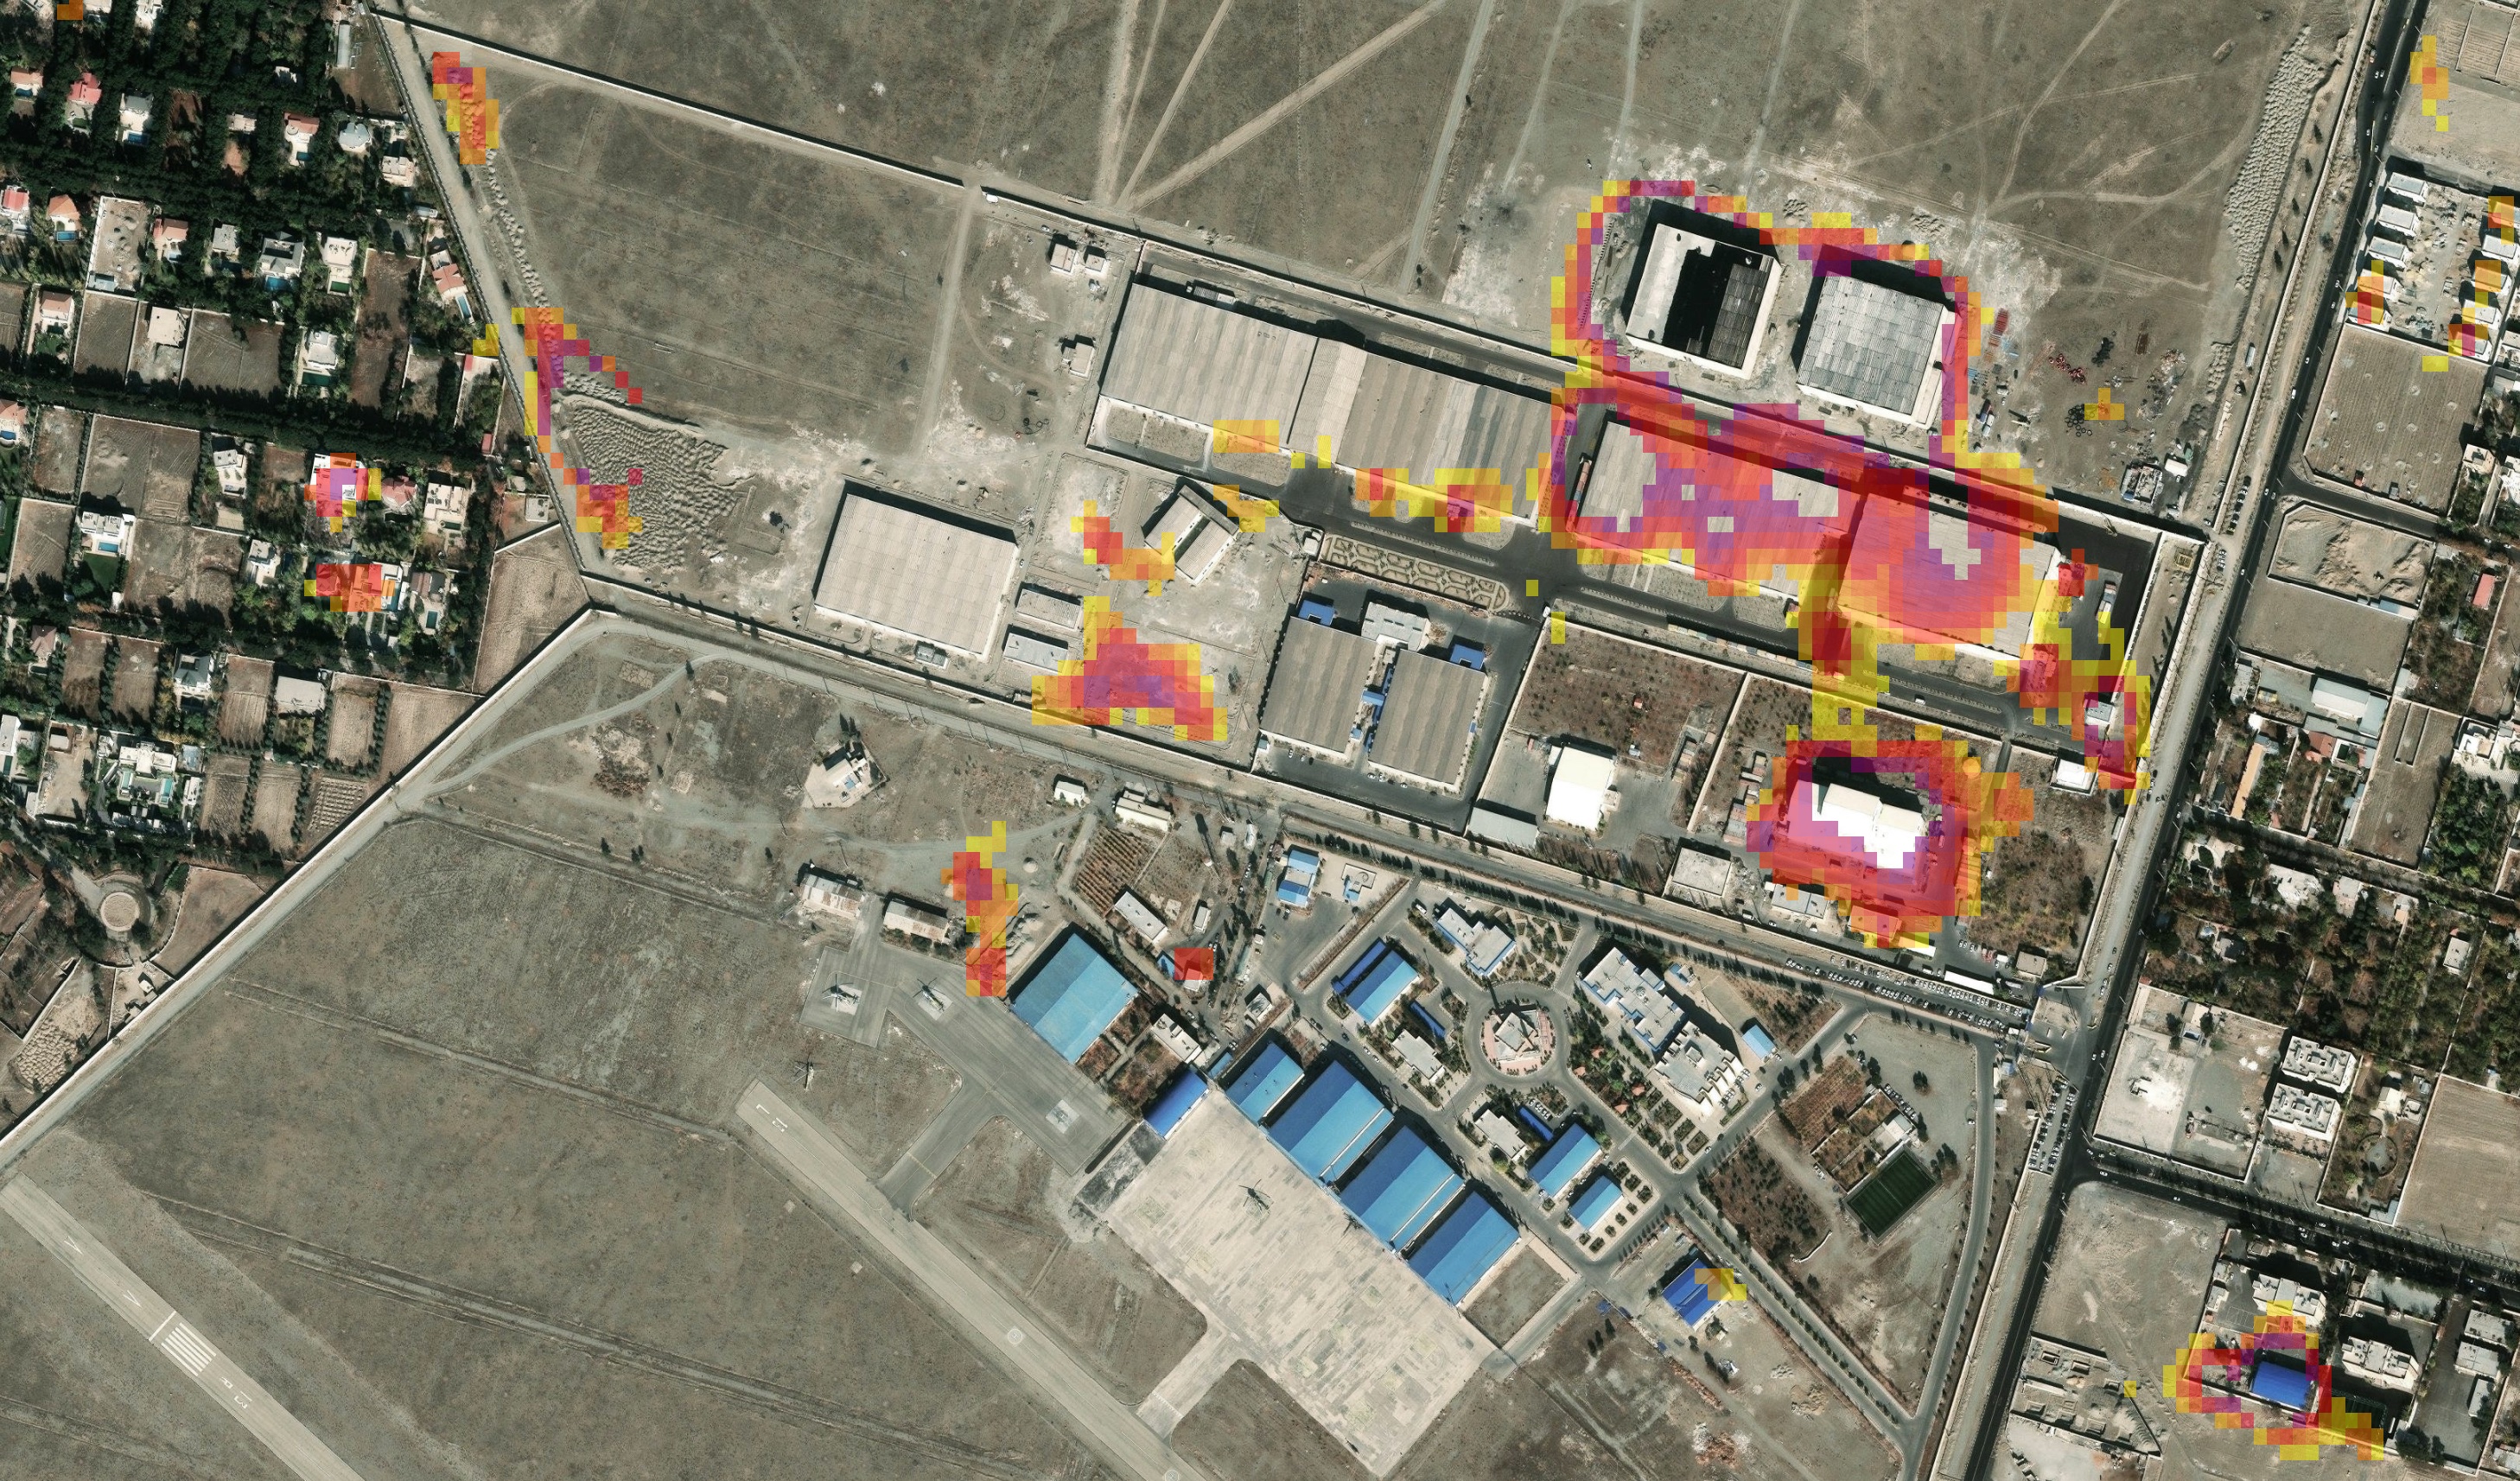
When the job finishes, a color-coded layer appears on your map. The default color scheme is:
🟣 Purple = strongest change signal (most significant)
🔴 Red = strong change
🟡 Yellow = moderate change (just above the detection threshold)
Transparent areas mean no significant change was detected.
What the Plugin Can Do
This plugin is a QGIS implementation of the original PWTT tool. Here is what it adds for everyday monitoring:
Limitations to Keep in Mind
Tips for Beginners
Start small. For your first run, pick a well-known location where you already know something changed (a documented demolition, a construction site). This lets you verify the results and build confidence in the tool.
Use longer baselines. The default 12-month pre-event window works well in most cases. A longer baseline gives the statistical test more data to establish “normal,” which reduces false positives.
Cross-reference everything. This tool is a starting point for investigation, not a final verdict. Always compare your findings with optical satellite imagery (Google Earth, Sentinel-2), news reports, and other open-source intelligence.
The T-statistic cutoff is your sensitivity dial. The default of 3.3 is a good balance. Lower it (e.g., 2.5) to catch more subtle changes (but more noise). Raise it (e.g., 4.0 or 5.0) to only see the most dramatic changes.
Further Reading
The original research paper explaining the PWTT method in detail: “Open access battle damage detection via Pixel-Wise T-Test on Sentinel-1 imagery” — published in Remote Sensing of Environment, 2025.
Bellingcat’s practical application of the tool: “When Satellite Imagery Goes Dark: New Tool Shows Damage in Iran and the Gulf” — April 2026.
The original PWTT code repository by Ollie Ballinger: github.com/oballinger/PWTT